
Every marketer focused on building an effective inbound marketing funnel has googled benchmark data for their lead generation strategies. We all want to know what metrics matter for measuring success and whether our marketing automation efforts are hitting the mark. The self-doubt starts creeping in as soon as we think we have answers.
We spiral down the Google rabbit hole wondering: "Should I be comparing my lead to opportunity rate to other SaaS platforms, or is it different for professional service firms?" "If my close rate is good but I don't have any leads, what does that mean?" And of course: "How does anyone get that many email opens??" We have enough on our plates figuring out what metrics we should be measuring, never mind knowing if those metrics are actually good once we measure them.
What are the right metrics?
We put our heads together and created this post that includes only the metrics we think you need to know. The most important numbers to track month over month are marketing qualified lead conversion rates and other key sales pipeline metrics within your lead generation funnel. These numbers are critical because of the amount of information conveyed in just one visual.
Here's how industry average benchmarks compare to a real company example. The contrast reveals exactly where optimization opportunities exist and which areas of your funnel need immediate attention.
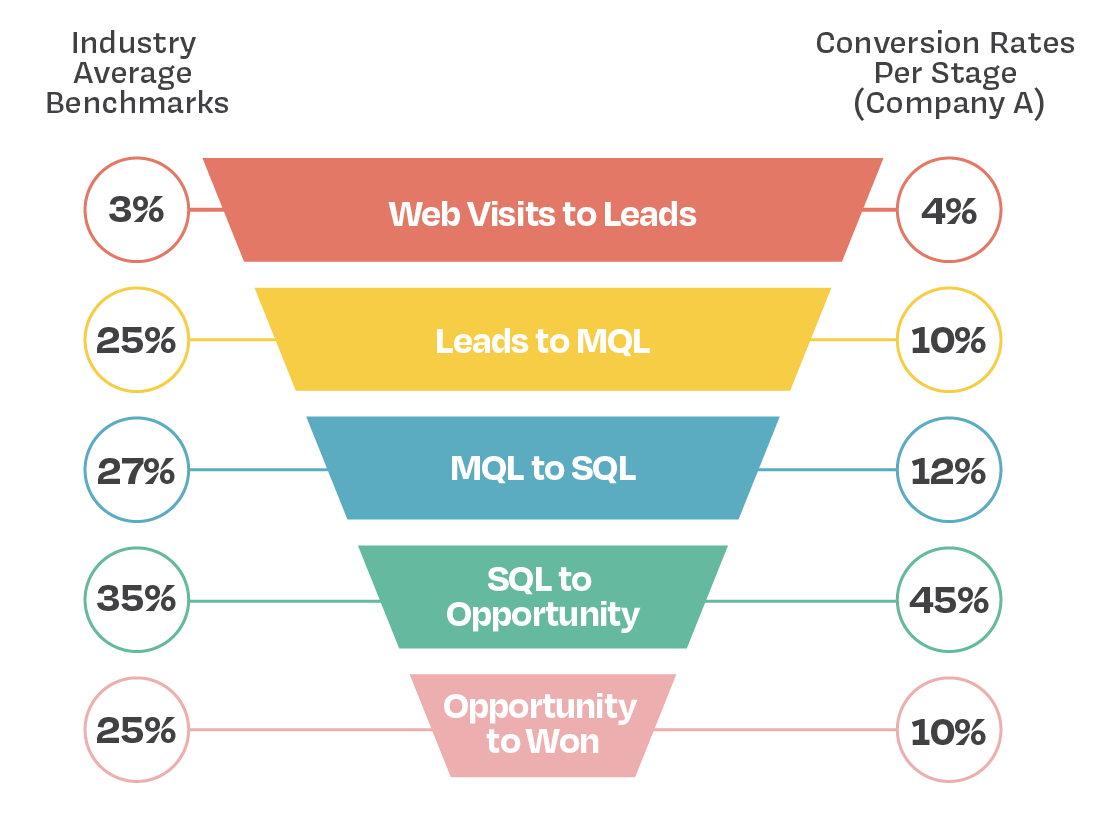
Comparing these two funnels shows exactly where Company A's lead qualification process breaks down:
The website is capturing leads (performing well). Those leads are not highly qualified based on the low conversion rate to MQL (needs improvement). The low conversion rate from MQL to SQL indicates a gap in content for the consideration stage (needs improvement). Those who are qualified have a high probability of requesting a proposal (performing well). Additional conversion rate optimization is needed in the closing process (needs attention).
This one chart identifies direct actions required to make an impact on the bottom line. Capturing this data for one channel month-over-month provides significant opportunities for improved marketing roi measurement through incremental improvements. The key is consistency in tracking and willingness to act on what the data reveals.
Conversion Rate Benchmarks for the B2B Inbound Marketing Funnel
Below are the average conversion rates for a B2B lead generation marketing funnel. You can generally swing that average up and down five points for a range as explained below.
.png?width=869&height=737&name=lbm-benchmark-conversion-rates-industry-average-benchmarks%20(1).png)
Most marketers need context for what each stage means before they can meaningfully improve performance. The benchmarks below offer clear definitions and realistic expectations for sales funnel performance tracking. Companies that understand these stages can pinpoint exactly where their funnel needs attention and avoid wasting resources on the wrong problems.
Website Visits to Leads (2-5% average)
Website visitor-to-lead conversion rates typically fall between 2-5%, representing visitors who show enough interest to provide contact information through forms, downloads, or lead magnets. Companies hitting the higher end of this range usually have compelling offers, clear value propositions, and landing pages designed specifically for conversion rather than general information sharing.
Leads to Marketing Qualified Leads (20-30% average)
Lead-to-MQL conversion depends entirely on initial lead quality and qualification criteria consistency. The 20-30% benchmark reflects organizations that have moved beyond collecting random email addresses to identifying prospects with genuine buying signals. Companies below this range often discover they're attracting the wrong audience or using qualification criteria that don't align with actual buying behavior.
MQLs to Sales Qualified Leads (25-30% average)
MQL-to-SQL conversion typically outperforms earlier stages because marketing teams have already filtered out obvious non-buyers. The 25-30% range represents organizations with clear handoff processes and aligned qualification standards between marketing and sales teams. Poor performance here usually indicates disconnect between what marketing considers "qualified" and what sales can actually work with.
SQLs to Opportunities (30-40% average)
SQL-to-opportunity conversion varies significantly based on sales team experience and market competition, with successful organizations typically seeing 30-40% conversion rates. This stage represents prospects moving from initial interest to active consideration and usually involves direct sales conversations, product demonstrations, or detailed needs assessment calls.
Opportunities to Closed Deals (20-30% average)
Opportunity-to-close conversion rates depend heavily on deal complexity, average sale value, and sales team closing skills. The 20-30% benchmark reflects organizations that properly qualify opportunities before entering them into the pipeline. Companies consistently below this range often discover they're advancing unqualified prospects or lack effective closing processes.
Lead Scoring and Qualification: MQL vs SQL Best Practices
Marketing qualified leads and sales qualified leads serve different purposes in the funnel, and confusing these stages costs companies real money. MQLs represent prospects showing interest through marketing activities like content downloads, webinar attendance, or email engagement. SQLs are prospects vetted by sales teams and confirmed ready for direct sales outreach.
Improving MQL-to-SQL conversion rates requires crystal-clear qualification criteria that both teams understand and follow consistently. Marketing teams should focus on lead scoring systems that identify genuine buying signals rather than simple engagement metrics, while sales teams need standardized processes for evaluating and advancing newly qualified prospects. Organizations that score leads based on both demographic fit and behavioral indicators typically see the strongest conversion performance.
Companies with the highest pipeline conversion rates maintain tight alignment between marketing and sales teams on qualification standards, but many organizations struggle with low conversion rates due to misaligned processes. Gartner's research on sales development metrics provides additional insight into addressing these common challenges. This alignment prevents qualified prospects from falling through organizational cracks and ensures sales teams focus their limited time on prospects most likely to close.
Factors That Influence The Average
Industry type, average customer value, and business size create significant variation in every conversion rate benchmark. Companies obsessing over whether their 18% MQL-to-SQL rate is "good enough" often miss the bigger picture: consistent measurement and systematic improvement matter more than hitting arbitrary industry averages. Organizations wanting detailed breakdowns by specific industry and channel can reference industry-specific lead-to-MQL conversion benchmarks for more granular comparisons.
Business Size Impact on Lead Generation Strategies
Business size creates predictable patterns in conversion performance across the entire funnel. Larger organizations typically see higher conversion rates due to sophisticated marketing operations, established lead nurturing systems, and experienced sales teams, but they also face longer sales cycles and more complex decision-making processes that can slow closing rates.
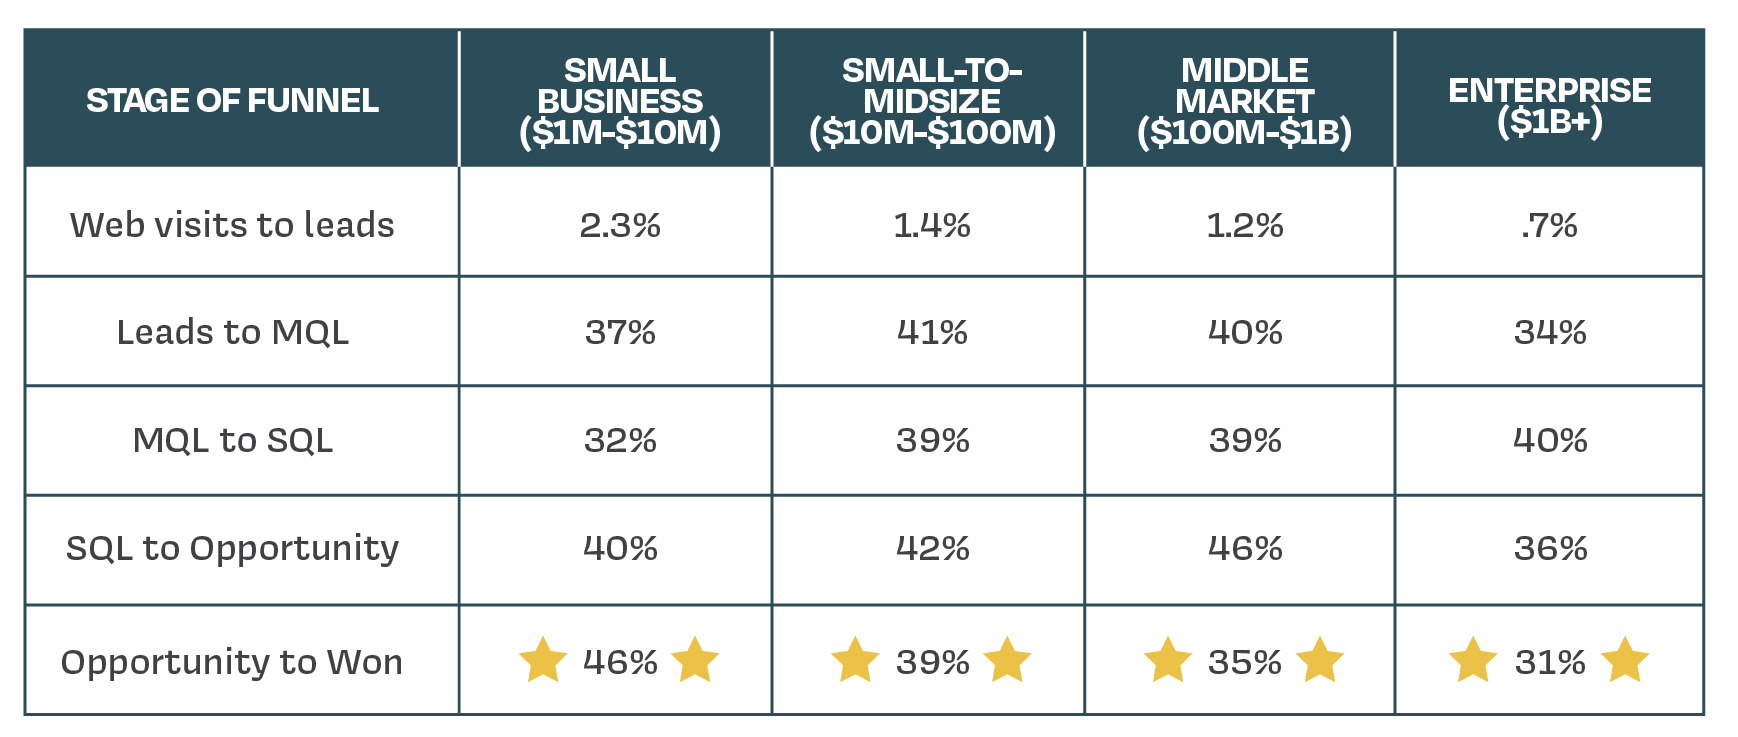
Small businesses often struggle with lead volume but can move prospects through the funnel faster due to shorter decision cycles and direct access to decision-makers. They typically lack sophisticated marketing automation but compensate with personal attention and quick response times.
Enterprise organizations benefit from sophisticated marketing operations and established sales processes but often face longer sales cycles and complex approval processes. They typically see higher overall conversion rates but longer time-to-close due to multiple stakeholders and risk-averse decision-making.
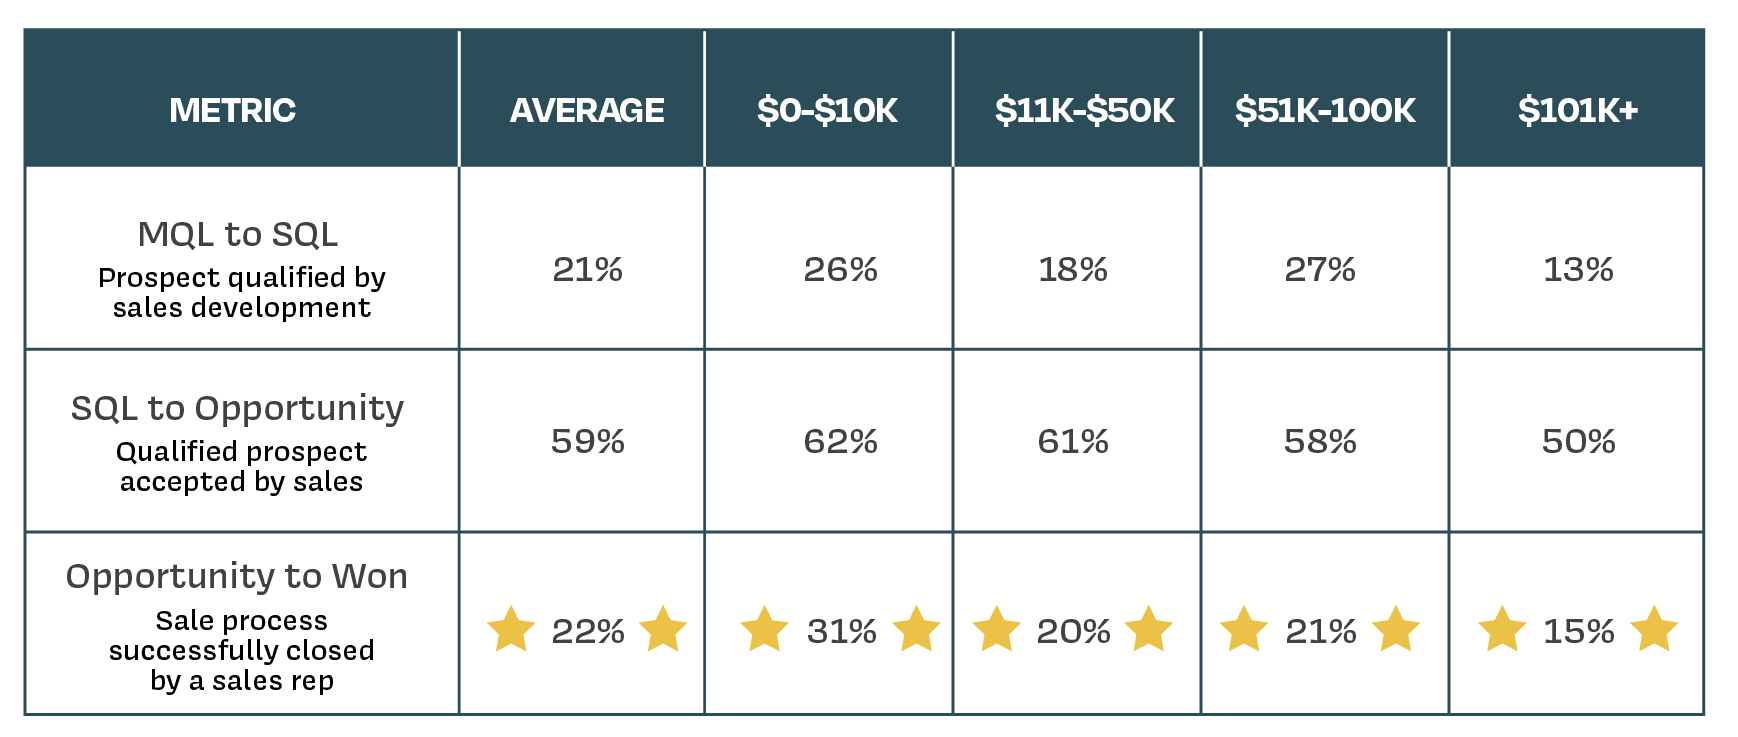
Average Customer Value Impact
Transaction value dramatically shapes how prospects move through the funnel and what conversion rates organizations should expect. Higher-value sales require more consideration time, involve multiple stakeholders, and demand extensive relationship building that naturally reduces conversion rates while increasing revenue per conversion.
Low-value transactions (under $5K): Organizations selling lower-value solutions typically see conversion rates on the higher end of benchmark ranges due to shorter sales cycles and less complex decision-making. These companies often focus on speed and efficiency over extensive nurturing, with success depending heavily on streamlined processes and quick response times to maintain prospect momentum.
Mid-value transactions ($5K-$50K): Deals in this range require more consideration time and typically see conversion rates in the middle of benchmark ranges, with lead nurturing effectiveness becoming critical for success. Prospects need sufficient information to justify the investment while sales teams must balance persistence with patience to avoid appearing pushy or desperate.
High-value transactions (over $50K): Complex, high-value sales often see lower conversion rates but generate higher overall revenue per conversion, requiring extensive relationship building and longer sales cycles. Success depends on demonstrating clear ROI, building trust with multiple stakeholders, and maintaining engagement throughout extended evaluation periods that can span months or quarters.
Making Your Marketing ROI Measurement Count
Industry-specific benchmarks will never perfectly match every organization's situation, but these broad conversion rates provide solid starting points for marketing attribution measurement. The Company A example demonstrates how benchmark comparisons reveal specific optimization opportunities rather than just highlighting performance gaps.
Successful organizations treat these benchmarks as baseline expectations rather than final goals. Companies should focus conversion rate optimization efforts on their biggest performance gaps first—addressing a 1% website-to-lead conversion rate before obsessing over closing percentages, or examining lead qualification criteria when MQL-to-SQL conversion significantly lags industry standards.
Consistent tracking matters more than perfect performance. Organizations that measure conversion rates month-over-month develop clear pictures of what constitutes good performance for their specific situation and build the data foundation needed to implement effective lead generation strategies. The companies that see the biggest improvements are those willing to act decisively when their data reveals areas needing attention.
Companies ready to optimize their lead generation funnel and improve marketing ROI measurement can benefit from systematic approaches to sustainable lead generation. The SOAR System helps B2B organizations move from marketing chaos to clarity through strategic, organized, accountable, and repeatable frameworks that deliver measurable results.


Let Us Know What You Thought about this Post.
Put your Comment Below.